
Speed Sensor Data
SPEED INDICATOR DEVICES (SID)
06 September 2021
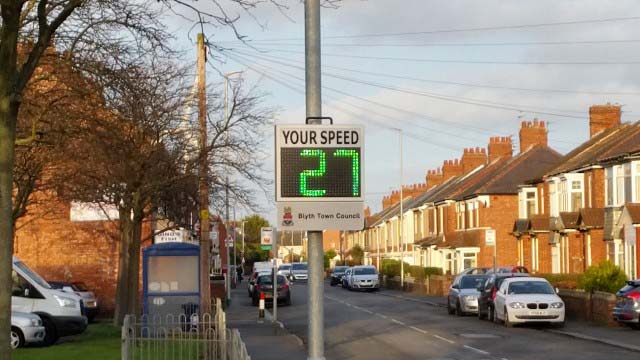
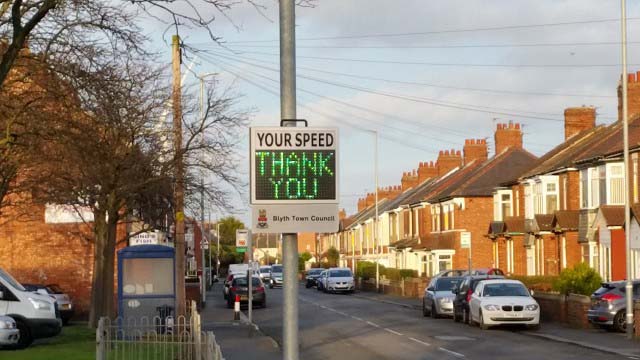
In an effort to reduce the speed of vehicles in and around the Town, Blyth Town Council have purchased a number of Speed Indicator Devices. These devices, or sensors as more commonly known, are temporary vehicle activated signs which detect and display real time vehicle speeds. The device will also record data that enables us to analyse various statistics about vehicle numbers, speed values and violations. From the data recorded we can produce detailed reports which can be shared with Northumbria Police and other relevant organisations.
The visual speed indication and thereby the attempt to influence the driver`s speed is quite a new field in the common road and traffic technology. Nowadays public authorities start to install luminary speed indication signs for the same purpose and additionally to manage the traffic flow. Besides avoiding traffic congestion, these systems also shall decrease the drivers speed in order to reduce the rate of accidents and the heaviness of their consequences.
Our system of a mobile, autonomous and numerical speed indication display fulfils this aim especially in communal and urban areas, speed limit zones, living areas and in front of schools.
The Speed Indicator Devices are regularly moved to different locations across Blyth. A monthly summary and Speed data table will be available to view on this page from each Speed Indicator Device from each location.
Drivers caught speeding can also suffer in many ways e.g. shame and embarrassment, points on a driving licence, fines, additional insurance premiums or disqualification.
Listed below are the abbreviations for the monthly speed data table:
Speed Violations Percentage of vehicles exceeding the speed limit
Vehicles Number of vehicles recorded during evaluation time
Vd (mph) Average speed of vehicles during evaluation time
Vmax (mph) Maximum speed recorded by sensor during evaluation time
Please see below the data for:
May 2024
Click here to view the data for May 2024 (Opens in new window.)
Apr 2024
Click here to view the data for Apr 2024 (Opens in new window.)
Feb 2024
Click here to view the data for Feb 2024 (Opens in new window.)
Jan 2024
Click here to view the data for Jan 2024 (Opens in new window.)
Dec 2023
Click here to view the data for Dec 2023 (Opens in new window.)
Nov 2023
Click here to view the data for Nov 2023 (Opens in new window.)
Oct 2023
Click here to view the data for Oct 2023 (Opens in new window.)
Sept 2023
Click here to view the data for Sept 2023 (Opens in new window.)
Aug 2023
Click here to view the data for Aug 2023 (Opens in new window.)
July 2023
Click here to view the data for July 2023 (Opens in new window.)
June 2023
Click here to view the data for June 2023 (Opens in new window.)
Older data is held on file.